State of AI applied to Quality Engineering 2021-22
Section 3.1: Inform & Measure

Chapter 2 by Capgemini & Sogeti

From good metrics to smart analytics

Business ●●●○○
Technical ●●○○○

Listen to the audio version

Download the "Section 3.1: Inform & Measure" as a PDF

Use the site navigation to visit other sections and download further PDF content

By submitting this form, I understand that my data will be processed by Sogeti as described in the Privacy Policy.*

Quality is never an accident. It is always the result of intelligent effort.
(John Ruskin)

The use of analytics and ML-based dashboards assist us in making informed decisions and increasing the effectiveness and efficiency of our activities.

In the previous chapter, we examined the importance of quality gates in our culture of continuous improvement. They contribute to increasing the level of transparency and improving our processes. More significantly, they rely on metrics to provide insight into our team's test progress, productivity, and the quality of the system under test. However, while our development techniques have evolved significantly over the previous five years, our metrics have mostly remained consistent.

Questions such as "what to test," "what to automate," "how to automate more," and "when to stop testing while maintaining the same level of quality" are still mostly answered by educated estimates and expert judgments.

What if we could address questions such as “Was our testing on target?”, “Why did issues happen?”, “How much time or effort will it take to fix future defects?”, “What should we test now?”. There are so many possibilities for establishing metrics in testing that the key criterion both teams and organizations as a whole should set for themselves is to ask:

  • Does having this metric help determine whether the software will be an asset to the business?
  • Are we able to eventually improve productivity of end users?
  • How metrics help us improve our effectiveness and efficiency?

In this chapter, we review the fundamentals of valuable metrics, and how AI can provide us with even smarter QE analytics.  

Choosing the right metrics

To set the ground, let’s spend one moment on various approaches to identifying metrics. TMAP recommends to approach metrics through an iterative and collective process. They define good metrics as being business centric, improvable, and inspiring action. metrics should be used for the right reasons. For instance, any indicators of test automation should keep us focused on the overall quality, rather than on achieving 100% automation. Computed metrics should allow us to:

  • Support testing activities and associated decisions
  • Continuously check the evolution (quality improvement or quality degradation) of quality as a set of continuously computed metrics
  • Use thresholds and compiled criteria, to act as quality gates in a continuous delivery pipeline.

Balancing effectiveness and efficiency 

Indicators help us monitor our ongoing activities and identify areas for improvement. As such, we must constantly review the effectiveness and efficiency of our efforts. Efficiency and effectiveness are two closely related notions with a subtle but nonetheless significant semantic difference.

  • Effectiveness indicates whether the outcome of the process has been realized or not. Unlike efficiency, effectiveness does not relate to the process itself, but to its outcome.
    • Percentage of unit tests pass, code coverage, requirements coverage, critical anomalies detected
  • Efficiency is the degree to which resources are utilized to accomplish a task. (Using a metaphor such as the shortest route to the target may be beneficial.) A process is said to be efficient when few resources are used in relation to the common, agreed-upon standard. For instance, these resources could be, for example, time, effort (person-hours), commodities, or money.
    • Percentage of automated tests, percentage of test costs, fault density
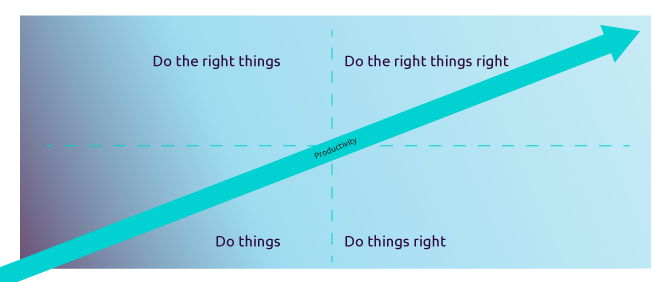
Figure: Productivity quadrant

Figure: Productivity quadrant

The value of metrics

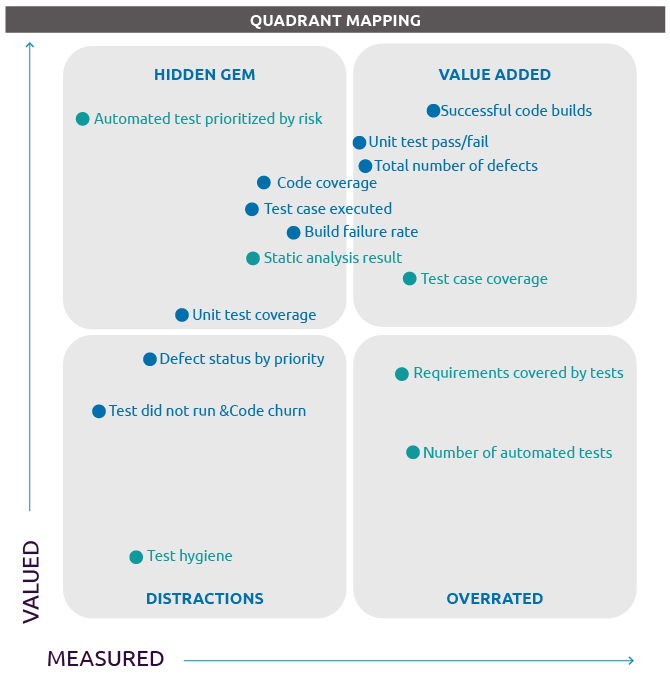
In 2019, Tricentis commissioned Forrester to conduct a research on what quality metrics are most critical for DevOps success. The findings have been compiled into a 55-page ebook, which categorized all the metrics across 4 value sections.

  • Value added: Metrics that are used frequently by DevOps experts and consistently rated as valuable by the organizations who measure them.
  • Hidden gem: Metrics that are not used frequently by DevOps experts, but are consistently rated as valuable by the organizations who measure them.
  • Overrated: Metrics that are used frequently by DevOps experts, but not rated as valuable by the organizations who measure them.
  • Distraction: Metrics that are not used frequently by DevOps experts, and not rated as valuable by the organizations who measure them.
Figure: Metrics quadrant


Figure: Metrics quadrant

Recent evolution of quality metrics

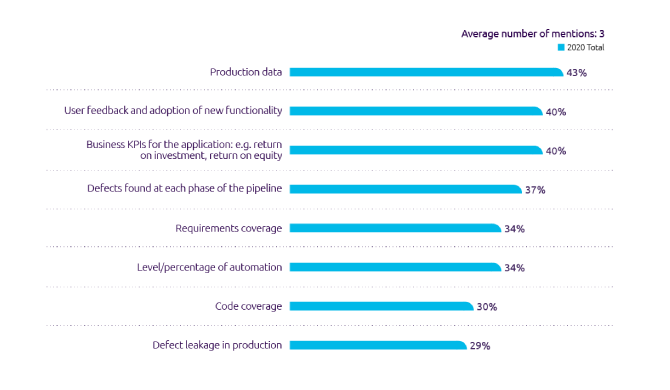
The 2020 State of Continuous Testing report shared that the top three metrics for the effectiveness of continuous testing focused on business results (production data, user feedback, and ROI). More than three-quarters of respondents (78%) said that “getting visibility throughout the development lifecycle” is a challenge when implementing continuous testing. This shows that organizations are maturing, and that they are looking more closely at the delivery of overall quality and value to the business and the end-customer.

Figure: Survey question from the 2020 Continuous Testing Report


Figure: Survey question from the 2020 Continuous Testing Report

When asked how they were tracking the effectiveness of continuous testing, the top three responses focused on the outcome of the functionality (production data, user feedback, and ROI). This suggests that the majority of respondents are more concerned with business outcomes than with process-level KPIs. However, because KPIs at the process/technical level are more actionable, teams will want to measure the metrics that support their work and decision making. As continuous testing matures, lower-level KPIs such as level of automation, requirements coverage, and defects found improve, and those results are seen in the top- level business metrics that reveal overall quality and value to the business and the end customer.

Quality metrics against the release frequency

For many, continuous delivery is the desired end state, allowing new functionality to be released as soon as it is developed. We believe the choice in quality metrics for a given product is highly dependent on this release cycle, be it immediate and incremental, a month long, or even longer. In the below table, we propose a mapping between the delivery schedule and examples of metrics.

Release frequency
Less than one day Between one day and one week Between one week and one month
  • Successful code builds
  • BVT Tests pass/fail rate
  • Change based automated selection & execution:
    • Static code analysis results
    • Automated code reviews
    • Unit Test pass/fail
    • Regression test pass/fail
    • Feature test pass/fail

Same measurements as of “less than one day- deployment frequency”, in addition to that,

  • Change based automated selection & execution:
    • Code coverage
    • Regression test (Number of Defects re-opened)
    • Functional coverage
    • Integration requirement coverage

Same measurements as earlier, in addition to Change based automated selection & execution:

  • Non-functional requirement coverage
  • System Requirement coverage
  • % Production/on-field failures

The rise of smart analytics

We have just examined that data can easily turned into metrics to monitor and track activities. Metrics mostly focus on the ‘what’, to gauge the performance or progress of our activities. However, metrics alone will not assist us in taking action, comprehending what is occurring, or improving results. Quality engineering activities generate a large volume of both structured and unstructured data that is frequently left idle and unused.

Recent development in AI can help turn data and metrics into smart analytics to assist us in making better decisions. For instance, it may render some of our prior tests obsolete, if comparable data is available. Additionally, we may be able to detect low-priority or low-value tests, such as those for features that are not being used.

Analytics can be collected to help validate our quality-in-use criteria and to get feedback on the effectiveness of the tests performed and those that were omitted for that release. Ideally, there will be no reported crashes or faults if our testing was "purpose-fit" (assuming any related issues were fixed prior to release). Additionally, as we acquire knowledge from analytics, we can then develop more effective testing for future application releases.

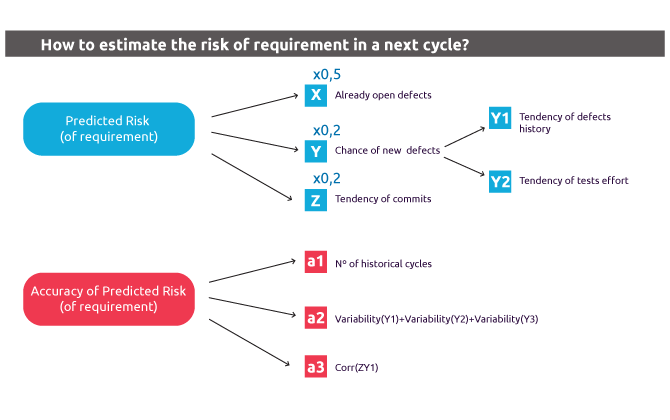
Similarly, product development manager will get insight into code churn happened in each build, build quality and test success rates in every phase of testing. Analytics can also serve to predict the percentage of risk of finding critical defects in production.

Figure: example of predictive analytics


Figure: example of predictive analytics

For the purpose of this chapter, we will focus on 3 categories of analytics capabilities, as described below:

Analytics capabilities
  Descriptive analytics Predictive analytics Prescriptive analytics
Objective Descriptive analytics can make testing data more informative and ascertain what occurred in the prior test cycles. That appears to be standard orchestration intelligence, but the source data spans across multiple repositories. Predictive analytics allows us to comprehend whatever insights we now possess and forecast what may occur. Machine learning can produce valuable insight into resource and time allocation. Prescriptive analytics help translate the above observations and forecast into tangible actions and generate concrete recommendations for what should occur, including the implementation of those recommendations.
Focus Report and analysis based on historical data Forecast and simulation to foresee critical issues, reduce reaction times, automate resolution Alerts and recommendations to optimize testing and increase defect detection
ML-driven use cases
  • Classify a new defect against severity levels, origin of defects, fixing time, etc.
  • Classify a new requirement with respect to level of testability
  • Classify a new or changed component according to error proneness
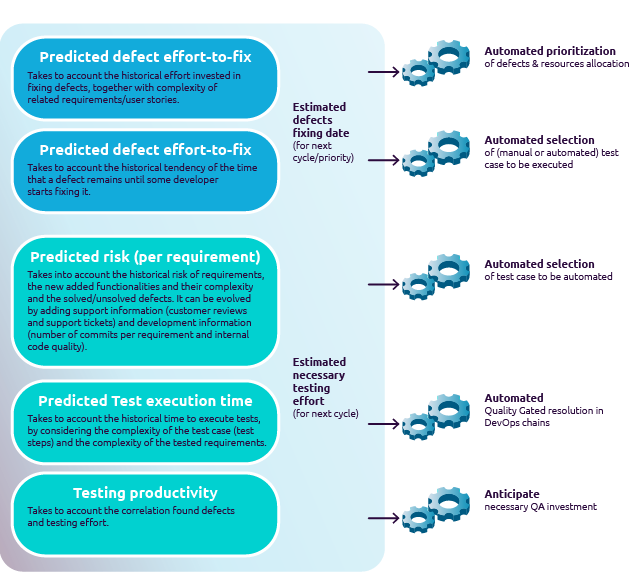
  • Improve test prioritization via the prediction of requirement risk
  • Improve test planning via the prediction of the expected number of defects and their severity
  • Optimize test resource allocation via the prediction of required test execution time
  • Feature prioritization per release
  • Test case prioritization to achieve the best possible outcome
  • Enhancement of test design scenario based on end-user´s usage patterns in production
Figure: Additional examples of smart analytics

FigureAdditional examples of smart analytics 

Concrete example using Cognitive QA

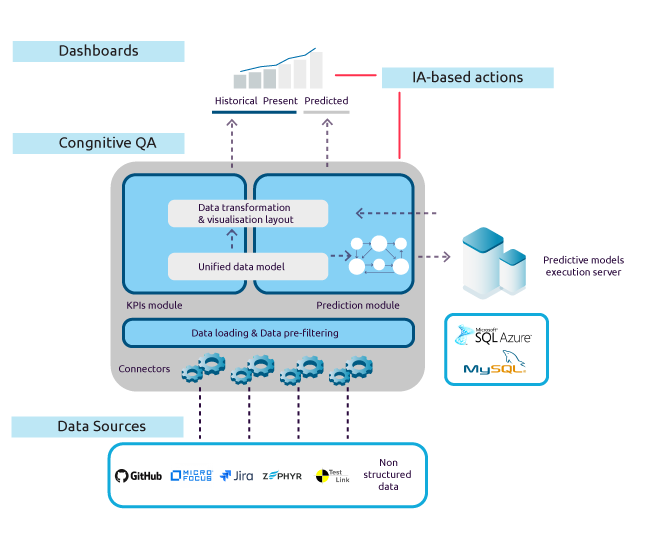
Cognitive QA is a real-time analytics platform developed by Capgemini that allows QA professionals to improve decision-making. While certain indicators are available but dispersed across multiple platforms, the goal is to function as a single control tower. Cognitive QA helps address typical challenges such as the inability to complete regression test cycle due to the volume of test cases, limited time, resource constraints or the lack of test automation strategy.

Figure: high-level architecture of Cognitive QA

Figure: high-level architecture of Cognitive QA

As the lack of data readiness and asset mapping equate to deployment ineligibility, an assessment of the quality, volume and integrity of data is performed before any consideration. Further investigation is performed around the following aspects:

  1. Identify what (real-time) information is missing in the decision process
  2. Prepare the various business and technical quality metrics and analytics
  3. Identify all data points required to measure quality
  4. Map data points to required data sources, e.g. requirement management, test case management, defect management, production tickets management, apps store feedback etc.)
  5. Verify the integration between the various systems
  6. Conduct a small pilot to check to ensure that quality-driven fields (to measure quality) are available in source systems and that engineers are entering the correct data. This is a significant step, as fields are very often either missing or incorrectly specified.
  7. If data is missing infields, then conduct change management for engineers to ensure right data is entered in system.
  8. Once all done, the final step is to correlate data, implement machine learning algorithms (not “one size fits all” type of approach), provide visualization, alerts, and chatbot integration.
Examples of dashboards
Descriptive analytics Predictive analytics Prescriptive analytics
  • 360 degree defects analysis
  • 360 degree test cases analysis
  • Productivity & Efforts
  • Automation summary
  • Defects summary
  • Production defects summary
  • Response & Performance summary
  • Prediction of anomalies
  • Prediction of the time to correct anomalies
  • Failure prediction of test cases
  • Prediction of design efforts
  • Predicting test execution efforts
  • What to automate
  • What to test
  • What if analysis
  • Defect to test cases mappings
  • Test case to requirement mapping
  • Duplicate entities (requirements, test cases, defects)

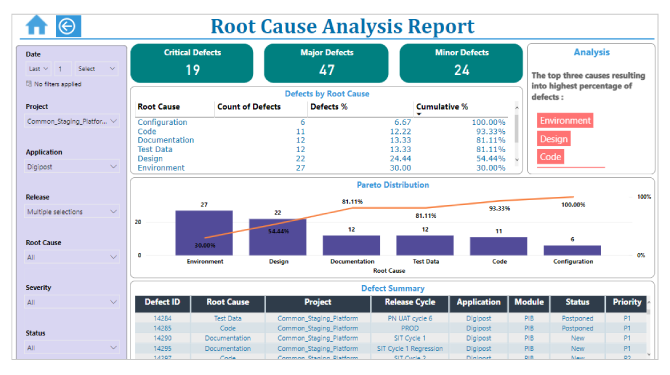
For instance, Cognitive QA enables us to do in-depth analyses to ascertain both the exact causes of problems and their impact on the system. In a typical manual approach, root cause analysis (RCA) can take days to weeks to complete. The ‘root cause analysis report’ illustrates an automated RCA report. It allows to take deep dive by project, application, module with automated pareto distribution. This really aids in determining where further resources/time should be invested to resolve challenges. This report employs a quasi-Monte Carlo algorithm with ranking, inclusive of a few more NLP techniques. One can employ a time machine to rerun the analysis. This enables us to draw lessons from previous releases and fine-tune our strategy.

Figure: Root Cause Analysis Report


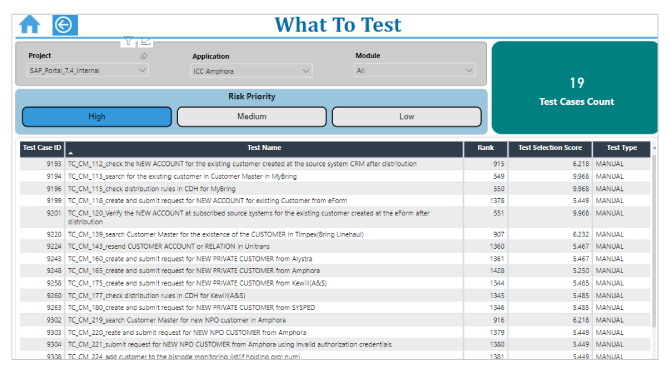
In the “what to test” figure, we examine how to increase quality with risk-based testing for every development build. Cognitive QA assists us in making decisions about which test cases to execute for a specific application or end-to-end flow. This can be accomplished through the use of a natural language processing (NLP) ranking approach.

Figure: What To Test


Often, the time available for the test cycle is so restricted that we are unable to finish the full regression cycle. However, we are under pressure to create high-quality work. Additionally, we may add a timing dimension to the data and prescribe a fixed set of test cases to ensure the highest possible test coverage in the allotted time. The Cognitive QA platform can help us identify high-priority test cases within a project by assigning a rank to each test case. Test selection ranking is determined using the test selection score, which is calculated by combining the execution score, the failure score, the defect score, the recency score, and the risk score for each test.

Example 1:

A storage corporation in the United States was examining how to prioritize tests and configurations depending on the likelihood of risk and failure. The idea was to save time and make better use of available hardware.

  • The platform recommended 325 high-priority test suites and 571 low-priority test suites out of a total of 896.
  • Only 44 configurations were assigned a high priority rating out of 192.

Example 2:

A vendor of medical imaging solutions was considering modifying their technique for selecting regression tests based on different inputs. The recommended test list should be included into the cycles of automated test executions. The platform correctly suggested focusing on 1,664 regression test cases from the 13, 721 existent ones.

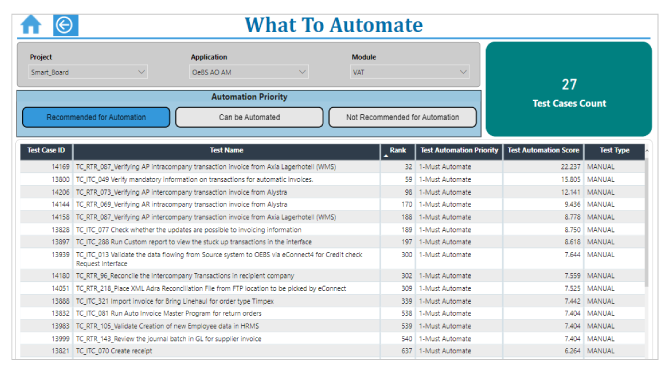
Figure: What to Automate


We must also consider the frequency with which test cases were conducted previously, the velocity of code changes, the interdependence of applications, test cases, and test data, as well as compliance, security, performance, and return on investment requirements. The figure "what to automate" assists us in prioritizing automated test cases. This can be performed by utilizing a natural language processing (NLP) ranking solution.

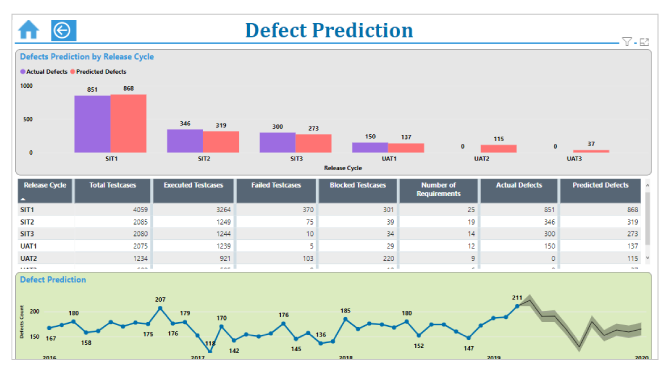
Having little to no visibility of risks and faults leakage in production is a recurring challenge, with direct impact on the business. For years, numerous methods have been employed to forecast problems with the high level of accuracy. The challenge is that no forecasting model can be simply estimated statistically from defect trends. It must also take into account code check-ins, requirement volatility, and a variety of other factors. The ‘defect prediction’ figure illustrates the range of the prediction model's output. Algorithms such as linear regression allow to reach 98% of accuracy.

Figure: Defect Prediction


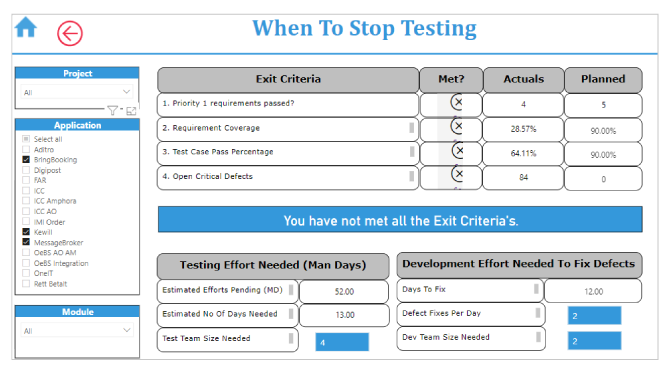
Now we have arrived at the critical choice point of "to be or not to be." The one decision that can propel a business to the next level or can erode customer trust and have a negative impact on revenue and brand reputation. There is always debate over whether we test enough or we test too much, and eventually, how we can deliver products on time and with the highest quality. As the DevOps pipeline process matures, it's also critical to consider how quickly we can respond to errors that occur in production. Occasionally, we can take a gold build, stabilize it in a test environment, and ensure that all problems discovered are addressed through hotfixes. We may also immediately release products and hotfixes. When to cease testing gives you all the information you need to make the best choice. It gives you with all the information necessary to make an informed decision. It generates recommendations based on machine learning, natural language processing, and key KPI inputs.

Figure: When To Stop Testing

About the authors

Maheshwar KanitkarMaheshwar Kanitkar

Maheshwar is a Senior technology executive with over 25 years of rich experience in large corporate and start-up environments. During this period, Maheshwar has performed several leadership roles in driving business (top-line and bottom-line), Innovation, R&D, Product Management, Partnership, Analyst relationship, Workforce Productivity, Talent Transformation, Project delivery. Maheshwar's Strength is in driving transformation internally within the organization resulting in significant growth and bottom-line impact and also working closely with the customer in helping them achieve their business transform. Maheshwar lead Innovation COE for AI and QE. Maheshwar has Hands-on expertise in Cloud, AI, Automation, Dev-OPS, test automation technologies, building High-Performance Multi-Cultural Leadership Team around the globe, and turn around project delivery. Maheshwar leads testing portfolio sales & solutions for Capgemini Europe.

Vivek Jaykrishnan

Vivek Jaykrishnan

Vivek Jaykrishnan is an enterprise test consultant and architect with extensive experience. He has over 22 years of experience leading Verification and Validation functions, including functional, system, integration, and performance testing, in leadership positions with reputable organizations. Vivek has demonstrated success working across a variety of engagement models, including outsourced product verification and validation in service organizations, independent product verification and validation in captive units, and globally distributed development in a product company. Additionally, Vivek has extensive experience developing and implementing test strategies and driving testing in accordance with a variety of development methodologies, including continuous delivery, agile, iterative development, and the waterfall model. Vivek is passionate about incorporating cognitive intelligence into testing and is also interested in exploring the frontiers of IoT testing.

Antoine Aymer

Antoine Aymer (chief editor)

Antoine Aymer is a passionate technologist with a structured passion for innovation. He is currently the Chief Technology Officer for Sogeti's quality engineering business. Antoine is accountable for bringing solutions and services to the global market, which includes analyzing market trends, evaluating innovation, defining the scope of services and tools, and advising customers and delivery teams. Apart from numerous industry reports, such as the Continuous Testing Reports, the 2020 state of Performance Engineering, Antoine co-authored the "Mobile Analytics Playbook," which aims to assist practitioners in improving the quality, velocity, and efficiency of their mobile applications through the integration of analytics and testing.

About Sogeti & Capgemini

Part of the Capgemini Group, Sogeti operates in more than 100 locations globally. Working closely with clients and partners to take full advantage of the opportunities of technology, Sogeti combines agility and speed of implementation to tailor innovative future-focused solutions in Digital Assurance and Testing, Cloud and Cybersecurity, all fueled by AI and automation. With its hands-on ‘value in the making’ approach and passion for technology, Sogeti helps organizations implement their digital journeys at speed.

Visit us at www.sogeti.com

Capgemini is a global leader in partnering with companies to transform and manage their business by harnessing the power of technology. The Group is guided everyday by its purpose of unleashing human energy through technology for an inclusive and sustainable future. It is a responsible and diverse organization of 325,000 team members in nearly 50 countries. With its strong 55 year heritage and deep industry expertise, Capgemini is trusted by its clients to address the entire breadth of their business needs, from strategy and design to operations, fueled by the fast evolving and innovative world of cloud, data, AI, connectivity, software, digital engineering and platforms. The Group reported in 2021 global revenues of €18 billion.
Get the Future You Want | www.capgemini.com